(804) 353-4500tswinfo@tswinvest.com
You are leaving TSW
You are now leaving the TSW website. This link is provided as a convenience, and Thompson, Siegel & Walmsley is not responsible for the content provided on your destination site.
You are now leaving the TSW website. This link is provided as a convenience, and Thompson, Siegel & Walmsley is not responsible for the content provided on your destination site.
We started the TSW International Small Cap Value strategy 15 years ago with the simple observation that this market segment offered an abundance of opportunity. Our investment process, aimed at a broad market capitalization universe across the developed and developing world, kept pointing us toward smaller companies that seemed curiously mispriced. We often found ourselves saying things like “this doesn’t make sense,” or “this would be worth more if it were listed in the U.S.”
We weren’t wrong. As you can see from the chart below, international small cap stocks have generated higher returns than their large cap brethren over the past 20 years—a period that includes financial crises, wars, pandemics, recessions, negative interest rates and the rise to prominence of mega-cap tech companies.
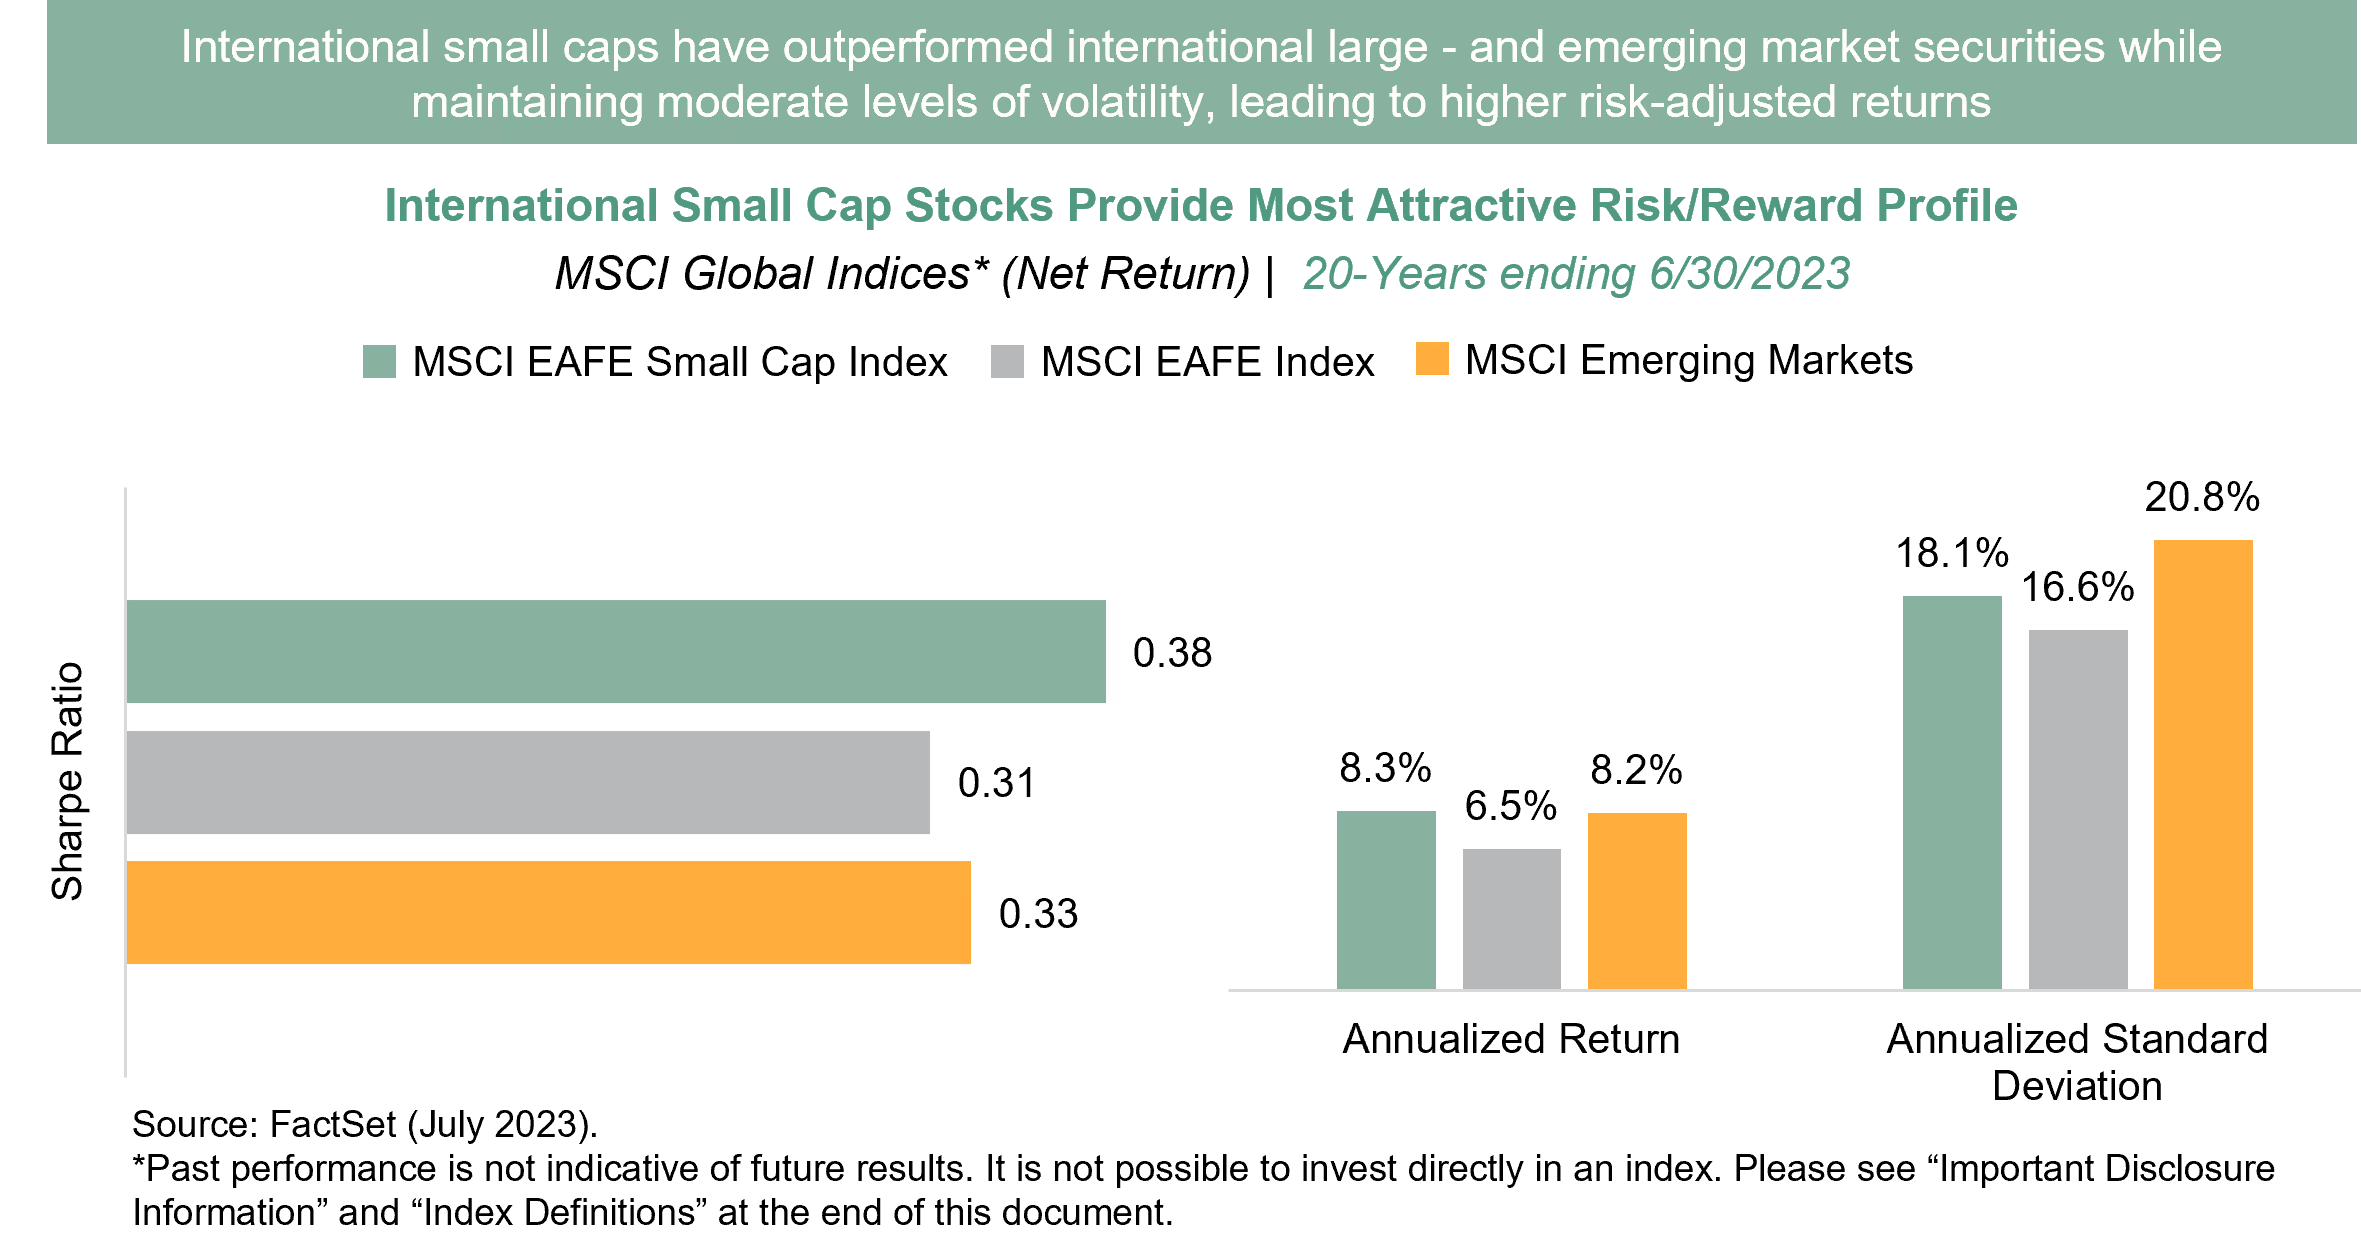
Contrary to many investors’ perceptions, international small cap stocks are not significantly riskier. The standard deviation of return depicted here is a measure of return variability, a common assessment of risk, and the Sharpe ratio adjusts the annualized return for that variability. A higher Sharpe Ratio means more return for every standardized unit of risk. International small caps have historically produced better risk-adjusted returns than large caps.
Standard Deviation and the Sharpe Ratio are wonky measures that can be hard to translate into real-world experience. Drawdown puts volatility into terms all investors can relate to: how much can I lose? In other words, how big is the decline from a prior peak? Over the past 10- and 20-year periods, international small caps have experienced a slightly larger maximum drawdown, but a smaller average drawdown - the mean of all drawdowns – than international large caps. The ride can occasionally be bumpier, but on average, it isn’t. We aren’t just speaking academically there. That maximum drawdown of nearly 60% in international small caps struck in 2008, our very first year of operation. We rode it out—we believe the ability to do so is critical to long-term success in small cap investing.

Why would smaller companies produce better risk-adjusted returns? Part of the answer is obvious: smaller companies can more easily grow at a faster rate. A company with $1 billion in sales enjoys 10% growth if it adds $100 million in new revenues, whereas that same $100 million only moves the needle 1% for a company with $10 billion in sales. All else equal, we believe investors will pay more for faster growth.
There are other reasons that are more subtle. Founders often have significant management roles and ownership stakes in small companies, which aligns in our view the interests of outside investors with the decision-makers at the company. “Skin in the game” is a powerful force, and we actively seek situations where “owner-operators” want exactly what we want - a great return on our capital, not just the maximization of a complex executive compensation scheme.
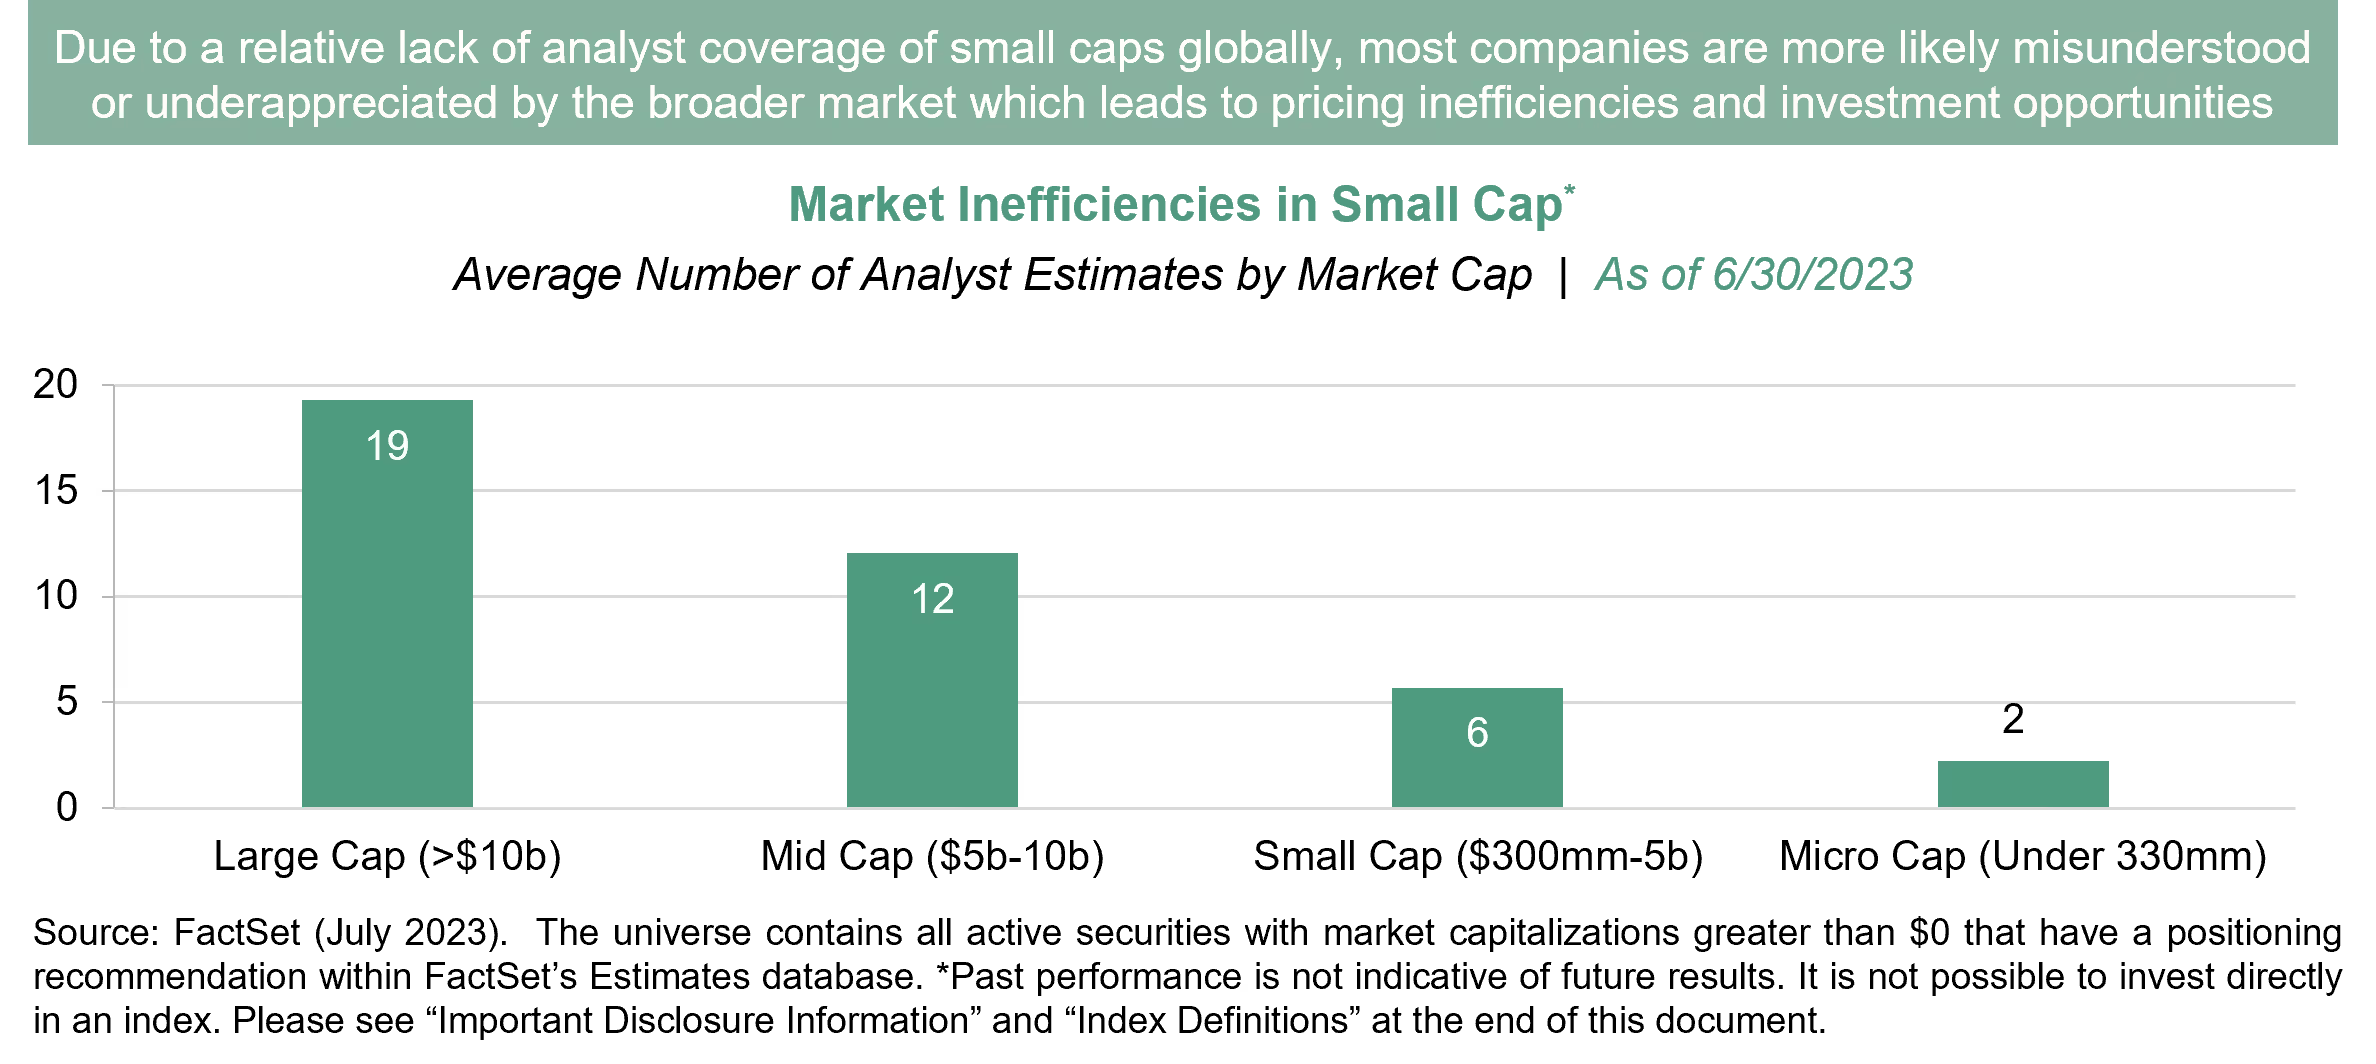
Small companies can also be neglected. The basis for passive investing is the assumption that markets are efficient - that the information that affects price and valuation is perfectly disseminated to all investors. As the accompanying chart shows, smaller companies are typically followed by fewer analysts, and they usually garner less attention than the big stocks that attract heavy trading and commission dollars. While analysts will frequently adjust their commentary and estimates for large companies that release reams of detailed data, they may only look at smaller companies once every quarter or two. This neglect can lead to mispricing, creating opportunities for active managers.
In our view these things add up to an above-average return opportunity in the real world. If we look at returns for the universe of international small cap managers, we can see that the median international small cap manager—not even the best managers—consistently beat the benchmark index, undermining the argument for passive investing in this asset class.

We don’t make market calls at TSW, but we believe international small caps presently offer an attractive investment entry point relative to larger stocks. Over the turbulent five-year period ending June 30, 2023, international small caps, as measured by the MSCI EAFE Small Cap Index, have underperformed the large cap EAFE Index by more than 300 basis points per year. While large caps returned 18.8% over the last twelve months, small caps were up just 10.2%. In a market environment pierced by uncertainty, investors seem to have flocked to safety in big, multinational companies with multiple product lines and end markets.
The performance differential leaves small caps looking inexpensive. The below chart compares the estimated price to earnings ratio of the EAFE Small Cap Index to the Large Cap EAFE Index over the last decade. The Small Cap Index is valued at only 12.8 times estimated earnings, the widest discount to the Large Cap Index in the last decade.

Smaller companies aren’t traditionally known for generous dividends because they often need to reinvest profits to grow, but the EAFE Small Cap Index currently sports an impressive dividend yield more than double that of U.S. peers and in line with international large caps. International small caps pay cash for investors willing to wait for the performance bump likely to emerge when investors feel more risk tolerant.

Valuation isn’t a great timing tool but we believe adding up the advantages in favor of small caps mentioned above suggests that the group will enjoy a catch-up at some point. In the last 20 years, the International Small Cap asset class has made 13 appearances in the top half of a ranking of global asset classes and has been number one or two seven times. Small caps were near the bottom in 2022. History suggests they won’t likely stay there. View the ranking of global asset classes here.
A wise economist once pointed out that there is no such thing as a free lunch, and in our estimation international small cap stocks are no exception to this maxim. Liquidity, measured by the dollar value of average daily trading volume, is a significant constraint for international small cap investors. At times, liquidity can dry up for small caps, making market entry and exit challenging, and this risk factor isn’t captured adequately in traditional risk factor analysis.
At TSW we manage liquidity risk by limiting our assets under management to an amount that is designed to preserve our ability to invest effectively in smaller companies and gives new clients an opportunity to capture the return pattern that older clients have experienced. We also have a trading team with an average of 26 years of experience that understands how to source liquidity in smaller names and keep the impact of our market activity light. And of course, we emphasize direct and frequent communications with our clients to accommodate their investment objectives in this specialized corner of the equity universe. The risk associated with small cap liquidity is real, but it can be mitigated through attention to the challenge.
Will international small cap stocks outperform large caps and other asset classes in the years ahead? Absolutely no one can say for certain, but in our estimation a review of history, valuation and the unique attributes of this market segment suggests the probability is favorable. We believe an allocation to actively-managed international small cap stocks can make sense in a well-diversified portfolio.
IMPORTANT DISCLOSURE: This commentary is intended for informational purposes only and does not constitute a complete description of our investment services, analysis, or performance. This commentary is in no way a solicitation or an offer to sell securities or investment advisory services. The expressed views and opinions contained herein are for informational purposes only, are based on current market conditions, and are subject to change without notice. Although information, opinions, and statistics contained herein have been obtained from sources believed to be reliable and are accurate to the best of our knowledge, Thompson, Siegel & Walmsley LLC (“TSW”) cannot and does not guarantee the accuracy, validity, timeliness, or completeness of such information and statistics made available to you for any particular purpose. This commentary should not be considered as investment advice or a recommendation of any particular security, strategy, or investment product. Past performance is not indicative of future results. No part of this commentary may be reproduced in any form, distributed, or referred to in any other publication, without express written permission of TSW.
GENERAL ECONOMIC & MARKET COMMENTARY DISCLOSURE: Comments and general market related projections are based on information available at the time of writing and believed to be accurate; are for informational purposes only, are not intended as individual or specific advice, may not represent the opinions of the entire firm and may not be relied upon for future investing. Certain information contained in this material represents or is based upon forward-looking statements, which can be identified by the use of terminology such as “may”, “will”, “should”, “expect”, “anticipate”, “target”, “project”, “estimate”, “intend”, “continue” or “believe” or the negatives thereof or other variations thereon or comparable terminology. Due to various risks and uncertainties, actual events or results or the actual performance of an Account may differ materially from those reflected or contemplated in such forward-looking statements. Investors are advised to consult with their investment professional about their specific financial needs and goals before making any investment decisions. Past performance is not indicative of future results.
BENCHMARK DESCRIPTION: MSCI makes no express or implied warranties or representations and shall have no liability whatsoever with respect to any MSCI data contained herein. The MSCI data may not be further redistributed or used as a basis for other indexes or any securities or financial products. This report is not approved, endorsed, reviewed or produced by MSCI. None of the MSCI data is intended to constitute investment advice or a recommendation to make (or refrain from making) any kind of investment decision and may not be relied on as such.
INDEX DEFINTIONS:
Bloomberg 1-3 Month U.S. Treasury Bill: The Bloomberg 1-3 Month U.S. Treasury Bill Index is designed to measure the performance of public obligations of the U.S. Treasury that have a remaining maturity of greater than or equal to 1 month and less than 3 months.
Bloomberg Barclays U.S. Corporate High Yield Index: The Bloomberg U.S. Corporate High Yield Bond Index measures the USD-denominated, high yield, fixed-rate corporate bond market. Securities are classified as high yield if the middle rating of Moody’s, Fitch and S&P is Ba1/BB+/BB+ or below. Bonds from issuers with an emerging markets country of risk, based on the indices’ EM country definition, are excluded. The U.S. Corporate High Yield Index is a component of the U.S. Universal and Global High Yield Indices.
Bloomberg Global Aggregate ex USD: The Bloomberg Global Aggregate ex USD Index is a measure of investment grade debt from 24 local currency markets. This multi-currency benchmark includes treasury, government-related, corporate and securitized fixed-rate bonds from both developed and emerging markets issuers. Bonds issued in USD are excluded.
Bloomberg U.S. Aggregate: The Bloomberg U.S. Aggregate Bond Index is a broad-based flagship benchmark that measures the investment grade, U.S. dollar denominated, fixed-rate taxable bond market. The Index includes Treasuries, government-related and corporate securities, fixed-rate agency MBS, ABS and CMBS (agency and non-agency).
FTSE EPRA Nareit Global Real Estate Index: The FTSE EPRA Nareit Global Real Estate Index Series is designed to represent general trends in eligible real estate equities worldwide. Relevant activities are defined as the ownership, trading and development of
MSCI EAFE Index: The MSCI EAFE Index is an equity index which tures large and mid representation across 21 Developed Markets countries around the world, excluding the U.S. and Canada. The Index covers approximately 85% of the free float adjusted market italization in each country.
MSCI EAFE Small Cap Index: The MSCI EAFE Small Cap Index is an equity index which captures small cap representation across Developed Markets countries around the world, excluding the U.S. and Canada. The Index covers approximately 14% of the free float adjusted market capitalization in each country.
MSCI Emerging Markets Index: The MSCI Emerging Markets Index tures large and mid representation across 24 Emerging Markets (EM) countries. The Index covers approximately 85% of the free float-adjusted market italization in each country.
MSCI United States Index: The MSCI USA Index is designed to measure the performance of the large and mid segments of the U.S. market. The Index covers approximately 85% of the free float-adjusted market capitalization in the U.S.
MSCI World ex U.S. Small Index: The MSCI World ex USA Small Index captures small representation across 22 of 23 Developed Markets (DM) countries (excluding the United States). The Index covers approximately 14% of the free float-adjusted market capitalization in each country.
MSCI World ex USA Index: The MSCI World ex USA Index captures large and mid representation across 22 of 23 Developed Markets (DM) countries excluding the United States. The Index covers approximately 85% of the free float-adjusted market capitalization in each country.
Russell 2000® Index: The Russell 2000® Index measures the performance of the small-cap segment of the U.S. equity universe. The Russell 2000 Index is a subset of the Russell 3000® Index and includes approximately 2,000 of the smallest securities based on a combination of their market cap and current index membership.
S&P 500® Index: The Index measures the performance of the large- segment of the market. Considered to be a proxy of the U.S. equity market, the Index is composed of 500 constituent companies.
EQUITY SECURITIES RISK: Equity securities generally have greater risk of loss than debt securities. Stock markets are volatile, and the value of equity securities may go up or down, sometimes rapidly and unpredictably. The value of equity securities fluctuates based on real or perceived changes in a company’s financial condition, factors affecting a particular industry or industries, and overall market, economic and political conditions. If the market prices of the equity securities owned by the strategy fall, the value of your investment in the strategy will decline. Your portfolio may lose its entire investment in the equity securities of an issuer. A change in financial condition or other event affecting a single issuer may adversely impact securities markets as a whole.
INTERNATIONAL INVESTING RISK: Investments in global/international markets involve special risks not associated with U.S. markets, including greater economic, political and currency fluctuation risks, which are likely to be even higher in emerging markets. In addition, foreign countries are likely to have different accounting standards than those of the U.S.
PRINCIPAL RISK: Risk is inherent in all investing. Many factors and risks affect performance. The value of your investment, as well as the amount of return you receive on your investment, may fluctuate significantly day to day and over time. You may lose part or all of your investment in your portfolio or your investment may not perform as well as other similar investments. An investment in the strategy is not a bank deposit and is not insured or guaranteed by the Federal Deposit Insurance Corporation or any other government agency. You may lose money if you invest in this strategy.
VALUE INVESTING RISK: The prices of securities TSW believes are undervalued may not appreciate as anticipated or may go down. The value approach to investing involves the risk that stocks may remain undervalued, undervaluation may become more severe, or perceived undervaluation may actually represent intrinsic value. Value stocks as a group may be out of favor and underperform the overall equity market for a long period of time, for example, while the market favors “growth” stocks.
For additional information regarding potential risks to your investment please see risk disclosures in our Form ADV Part 2A found here https://www.tswinvest.com.
© 2023 Thompson, Siegel & Walmsley LLC (“TSW”). TSW is an investment adviser registered with the SEC. Registration does not imply a certain level of skill or training. All information contained herein is believed to be correct but accuracy cannot be guaranteed. TSW and its employees do not provide tax or legal advice. Past performance is not indicative of future results; past performance does not guarantee future results, and other calculation methods may produce different results. There is the possibility of loss of principal value. Certain GIPS® disclosures are provided on TSW’s website at www.tswinvest.com, others are available upon request. TSW is a trademark in the United States Patent and Trademark Office.
Published July 2023
Subscribe to receive the latest news and updates
You are now leaving the TSW website. This link is provided as a convenience, and Thompson, Siegel & Walmsley is not responsible for the content provided on your destination site.
You are now leaving the TSW website. This link is provided as a convenience, and Thompson, Siegel & Walmsley is not responsible for the content provided on your destination site.
You are now leaving the TSW website. This link is provided as a convenience, and Thompson, Siegel & Walmsley is not responsible for the content provided on your destination site.