(804) 353-4500tswinfo@tswinvest.com
You are leaving TSW
You are now leaving the TSW website. This link is provided as a convenience, and Thompson, Siegel & Walmsley is not responsible for the content provided on your destination site.
You are now leaving the TSW website. This link is provided as a convenience, and Thompson, Siegel & Walmsley is not responsible for the content provided on your destination site.
“Alpha is not in your cash-flow estimates. It’s not in your discount rates. And it’s not in your cheap multiples.”1 We believe successful investing is about having a variant perception. This may seem like a technical concept, but for us, it’s as simple as the old saying: “If you’re at a poker table and you don’t see a sucker … it’s you!” At TSW, we dedicate the lion’s share of our work to distinguish our perceptions from the market’s and successfully invest when there is a material difference. In our view, this is where true alpha comes from.
Mid-cap equities tend to outperform over time, where fundamentals, as opposed to irrational (or speculative?) exuberance, drive returns. In such periods, markets typically favor companies that generate consistent, solid cash flows—which is precisely what we endeavor to own. We thus encourage investors to think of the strategy as a long-term holding with the potential to earn attractive returns while helping to dampen broader portfolio risk.
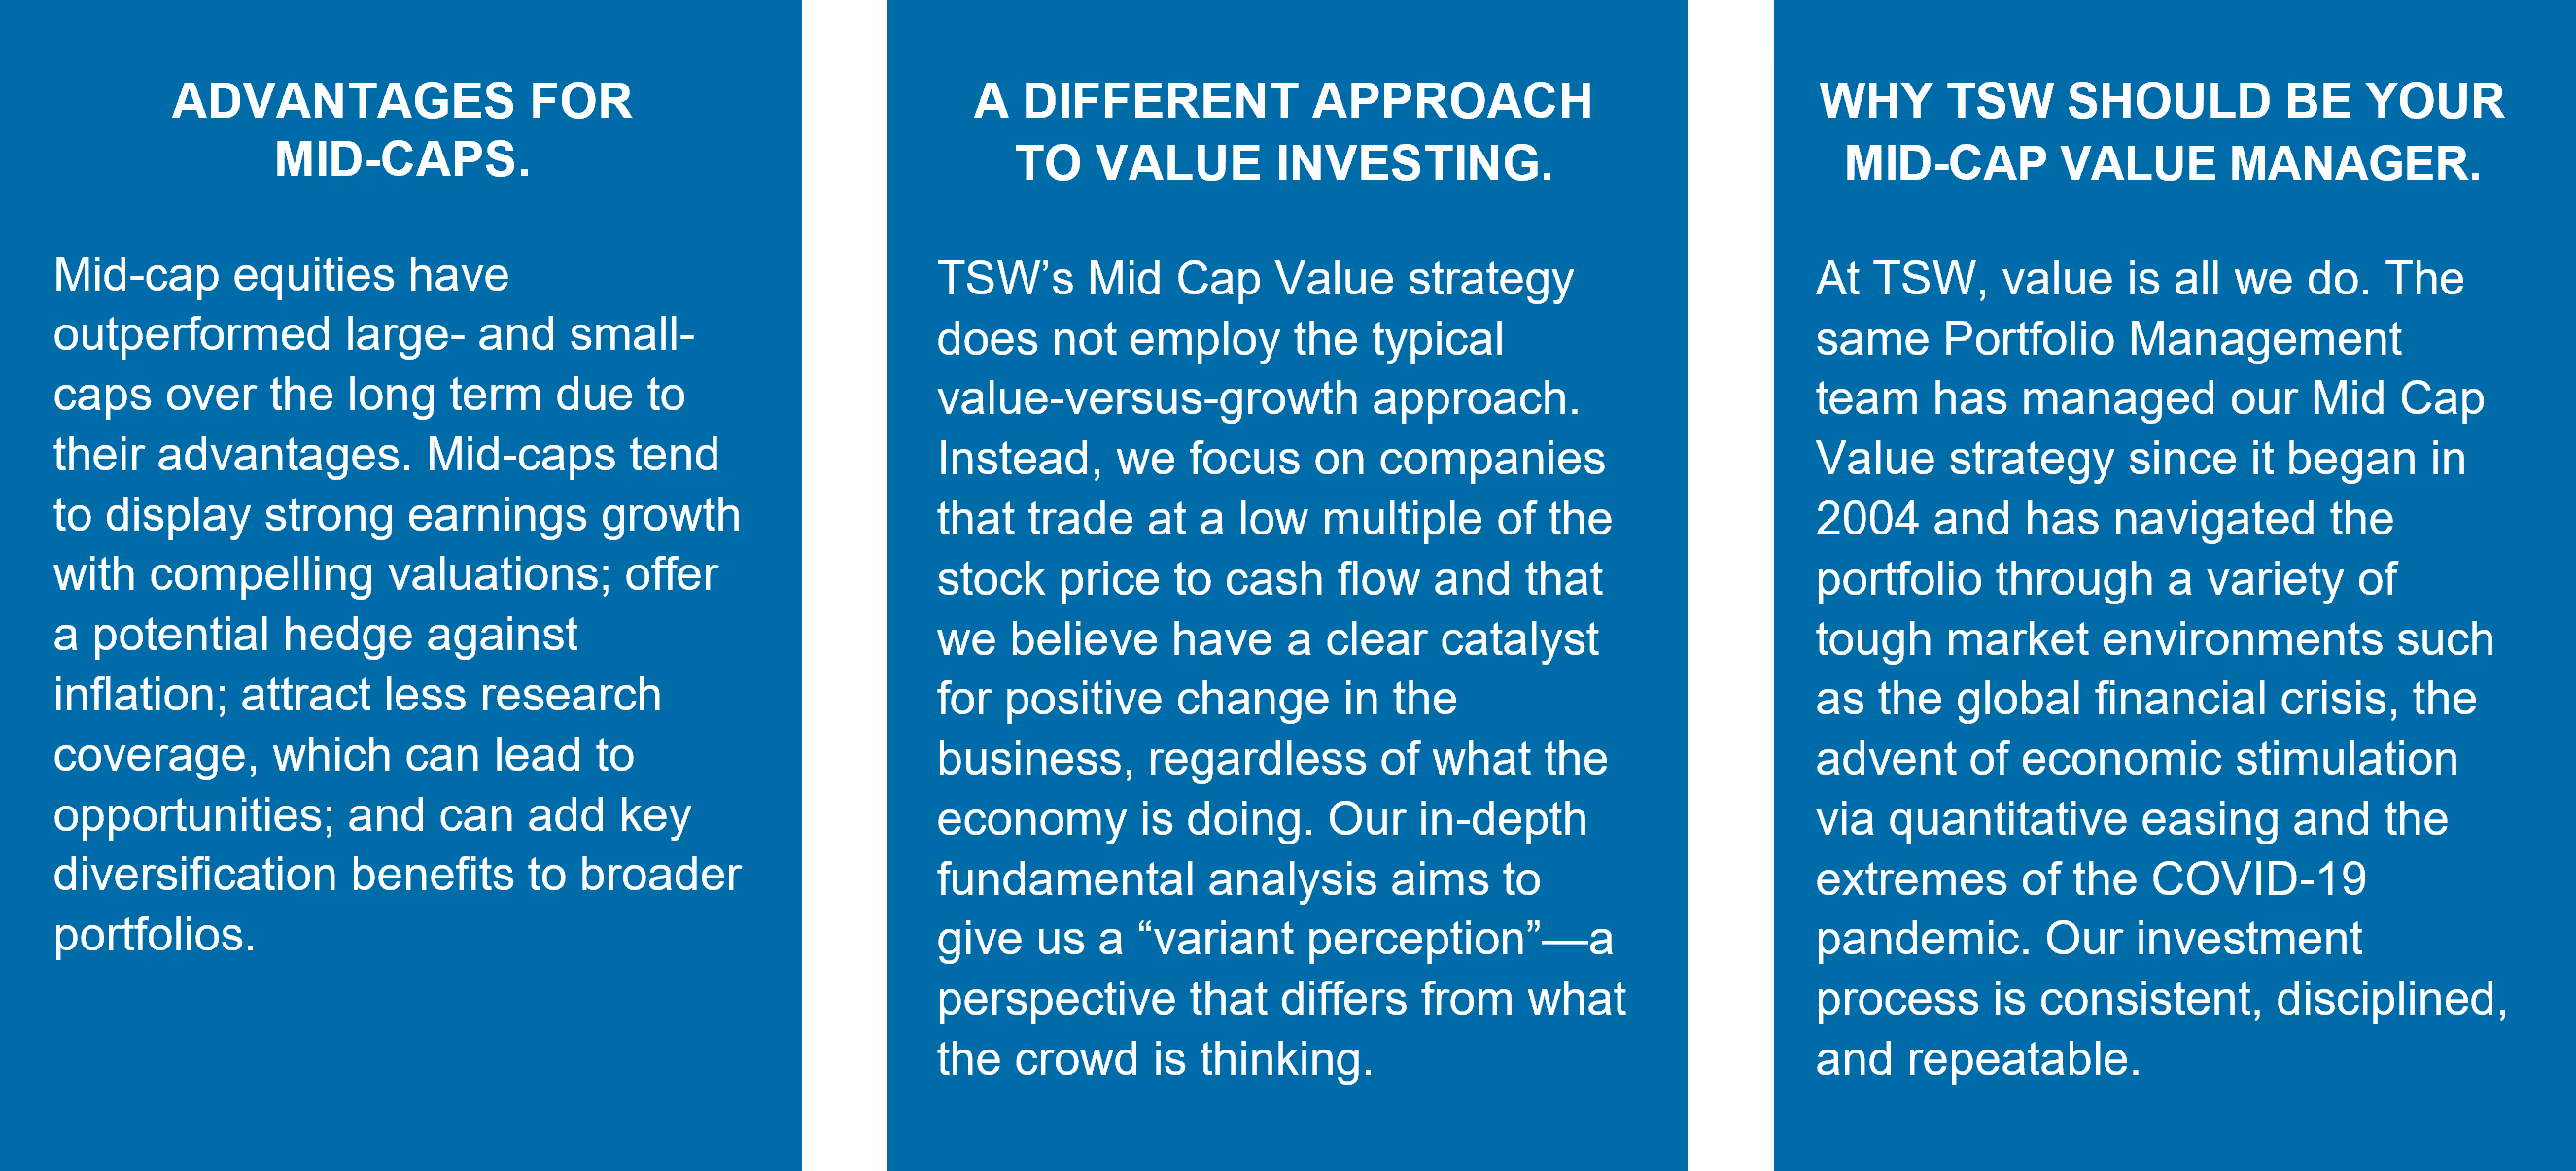
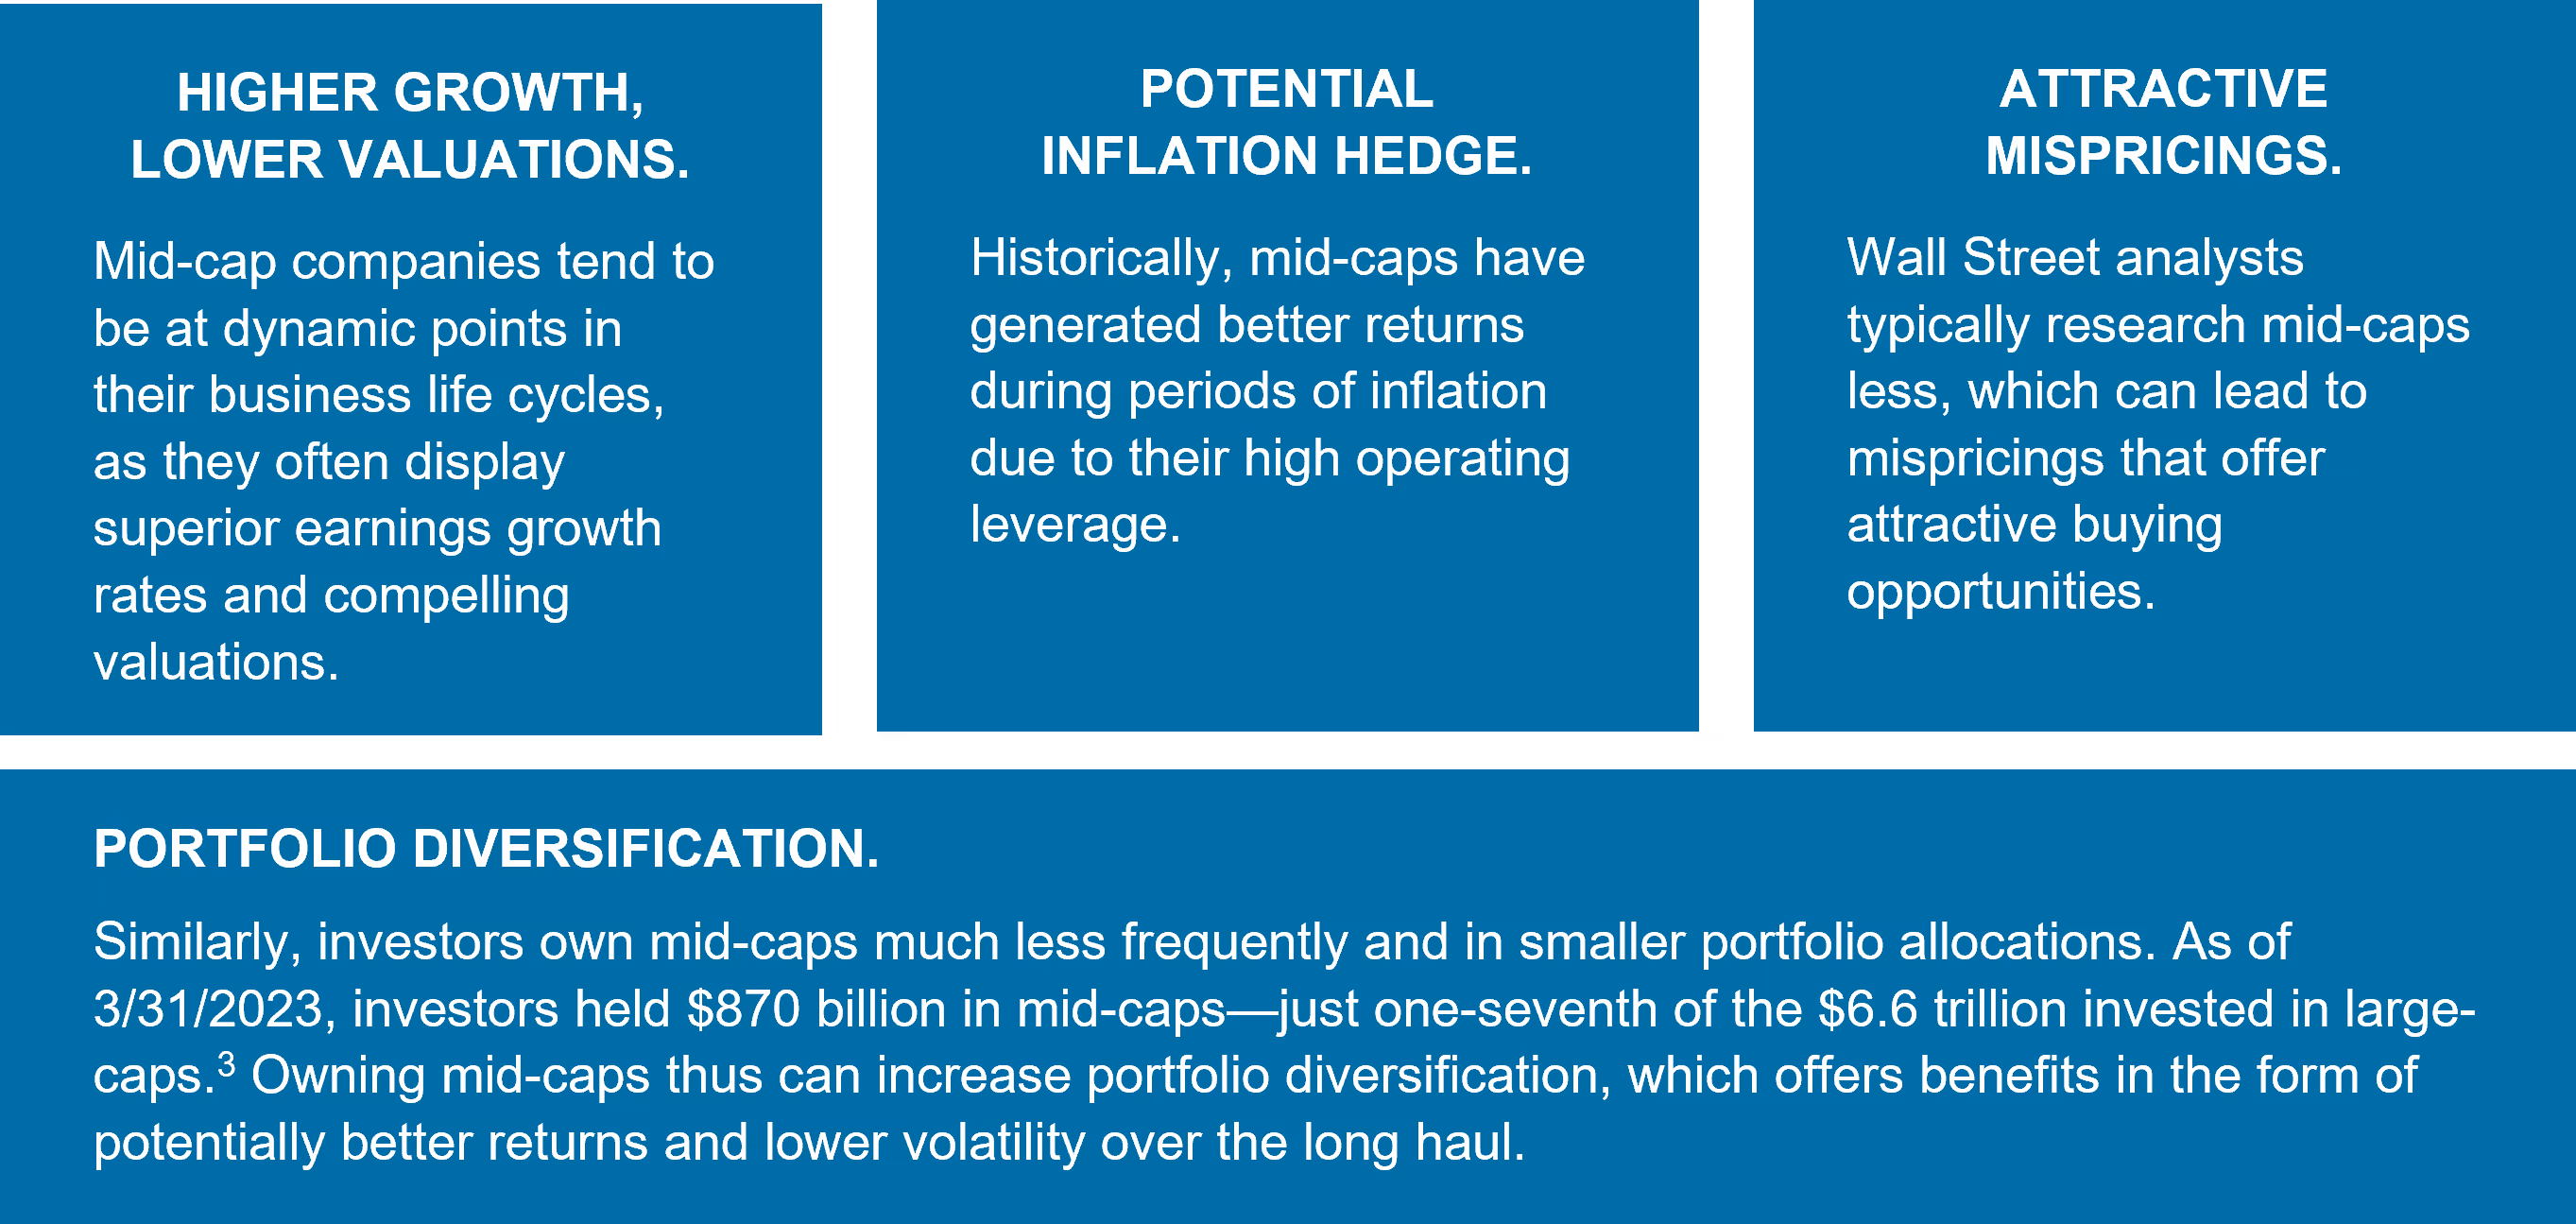
Mid-cap equities occupy the middle ground in market capitalization, between large- and small-cap companies. We define mid-caps more specifically as stocks whose capitalization ranges from $6 billion to $47 billion.2 Mid-cap companies are typically large enough to have well-established management teams, broad distribution channels, and ready access to capital markets, and they may grow more quickly than their large-cap counterparts. Over time, this combination of stability and superior earnings growth potential has helped mid-caps outperform.
These advantages would be meaningless if mid-caps didn’t back them up with long-term performance—and mid-caps’ performance over the years has, in our view, been stellar (Figure 1). $1,000 dollars invested in mid-caps starting 30 years ago (3/31/1993) grew to $19,771 at the end of 3/31/20234, while large-caps grew to $16,470 and small-caps only grew to $11,778. (Figure 1)
Figure 1. Mid-caps have significantly outperformed large- and small-caps over the long term.
Mid-cap stocks have surpassed small- and large-cap stocks | Growth of $1,000.
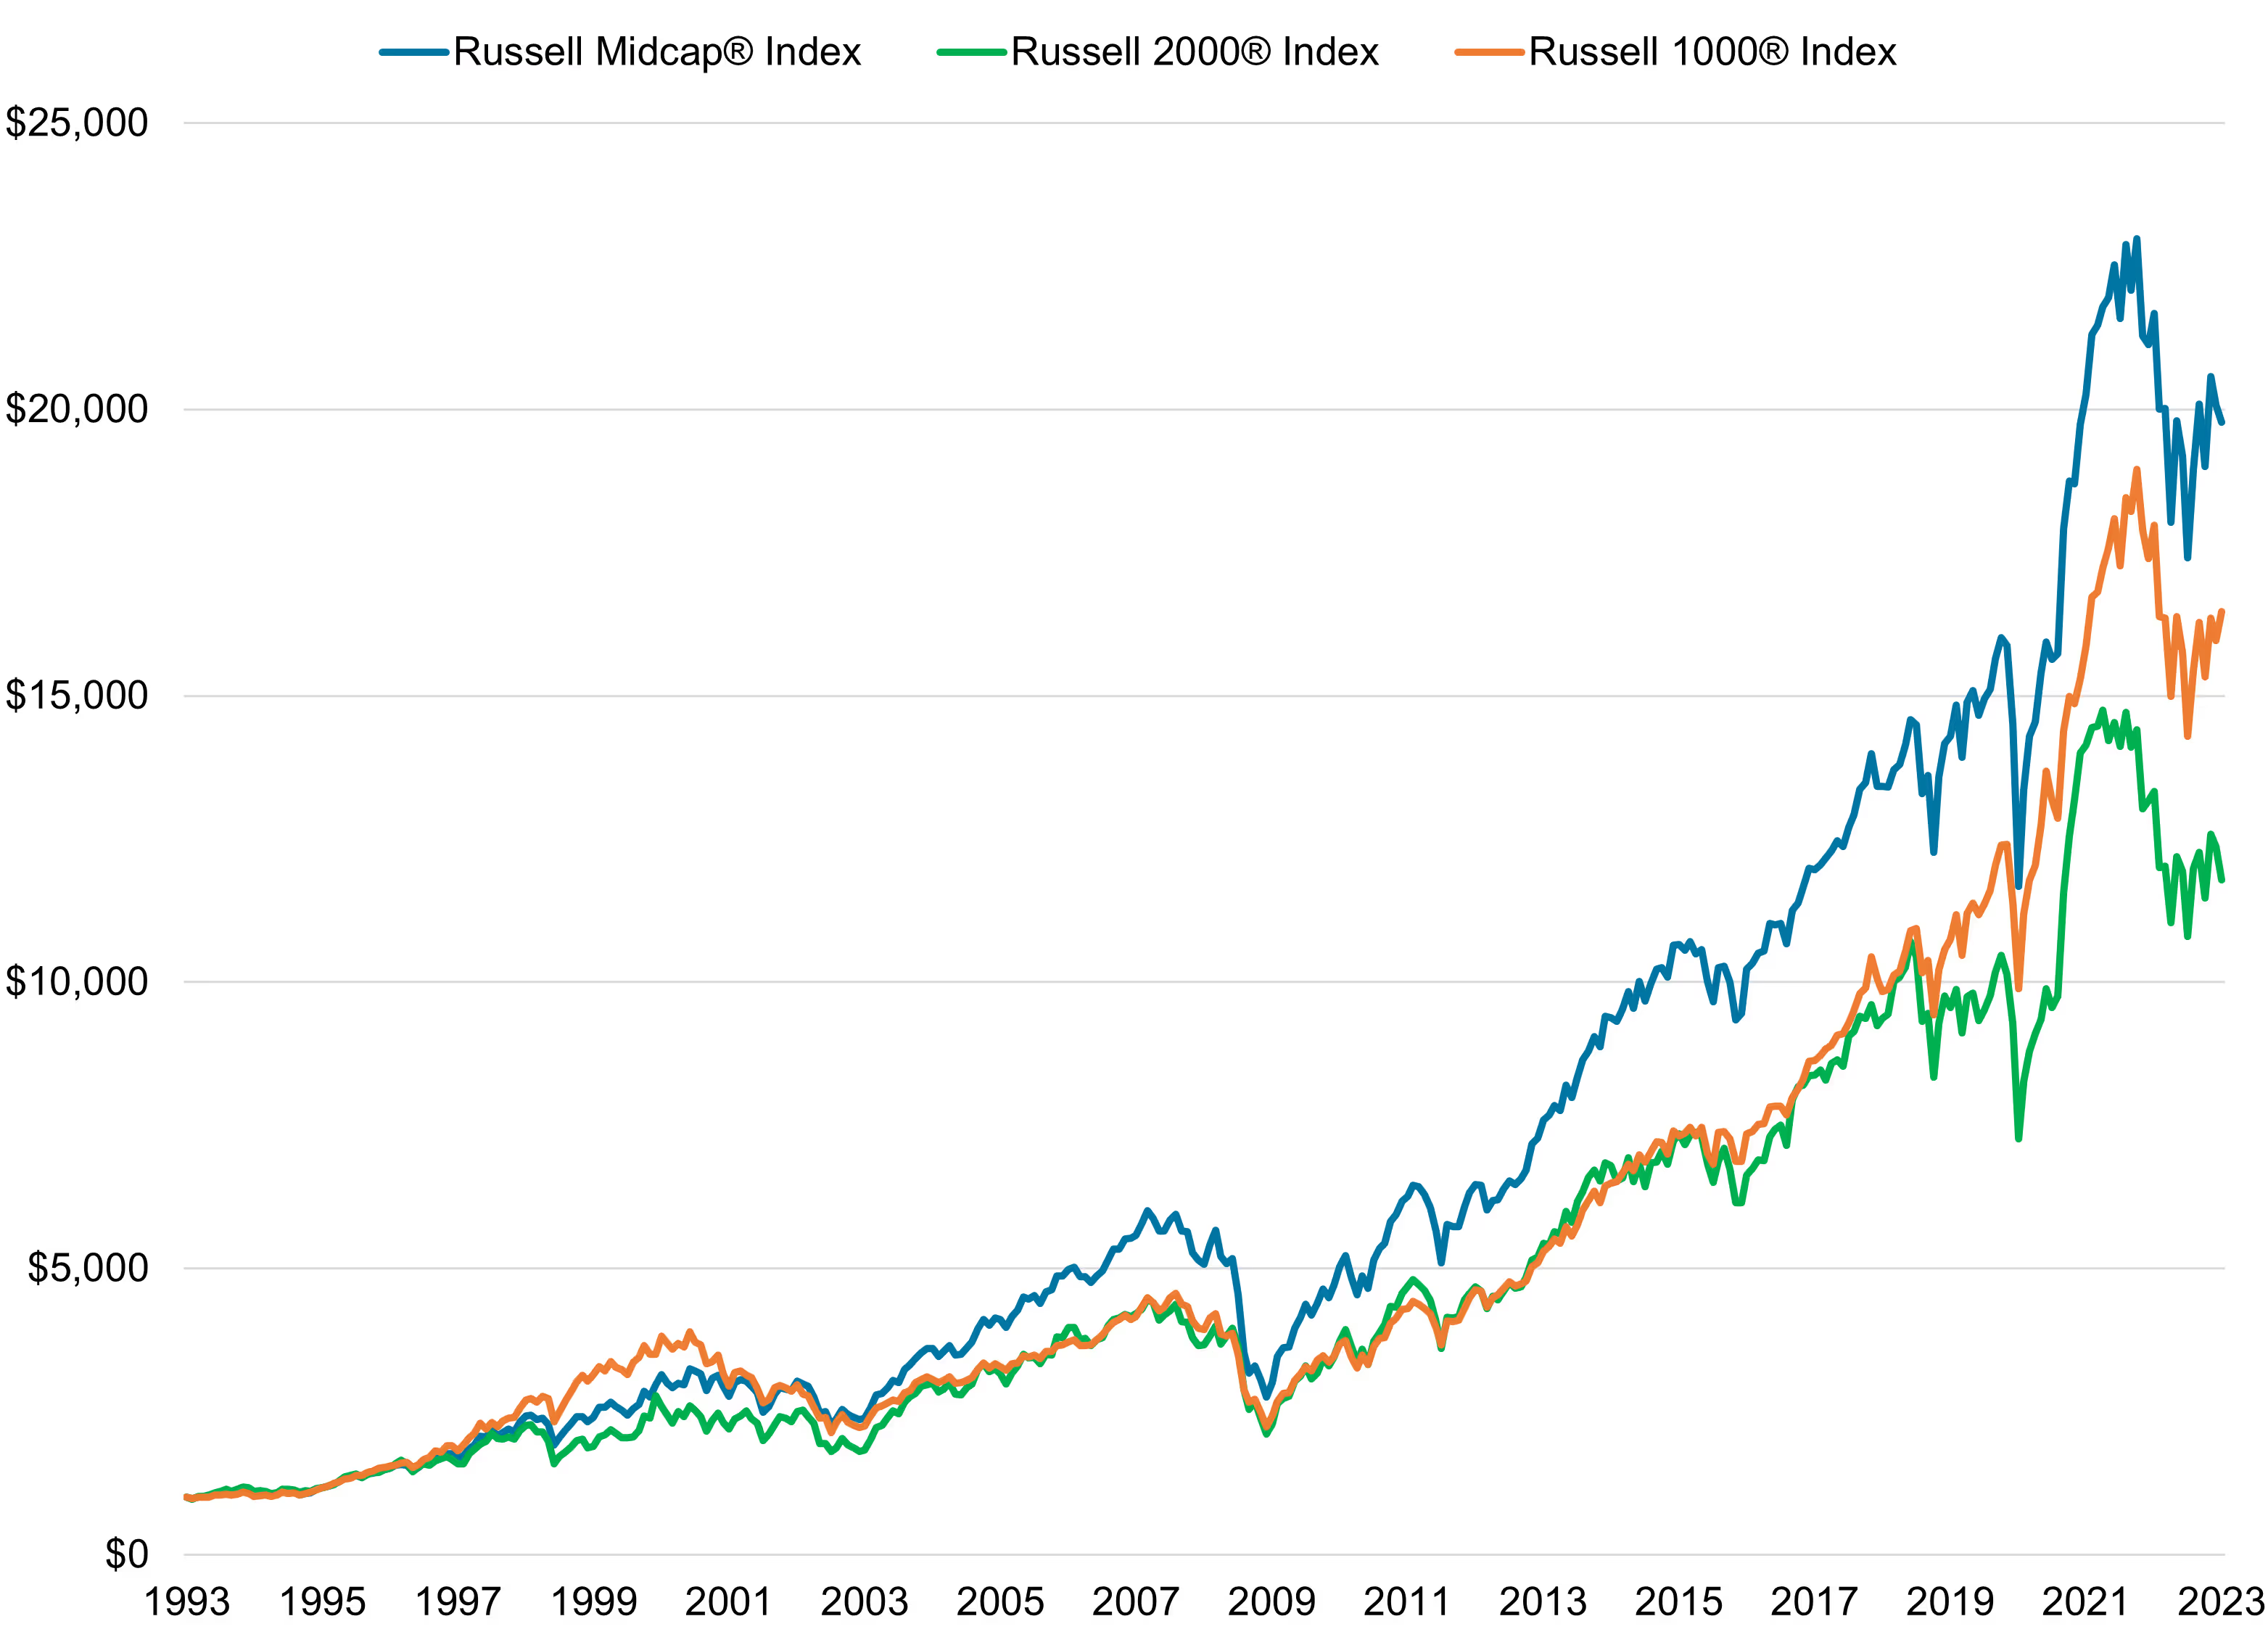
What’s more, mid-caps have outperformed when taking risk into account. Since the inception of the FTSE Russell equity indices in 1978, mid-caps’ risk-adjusted returns have exceeded those of large- and small-caps over the vast majority of rolling 20-year periods5.
At TSW, we focus on value investing. Our approach to value, however, differs from the traditional method that seeks the cheapest stocks as measured by the ratio of the stock price to the underlying company’s book value. In other words, it’s not value investing in the conventional value-versus-growth sense.
We believe that companies trading at a low multiple of the stock price to the company’s cash flow, combined with what we determine to be a clear catalyst for positive change in the business, offer the highest risk/reward opportunities. Our in-depth fundamental analysis of these companies aims to give us a perspective that differs from what the crowd of other investors is thinking – our “variant perception…”.
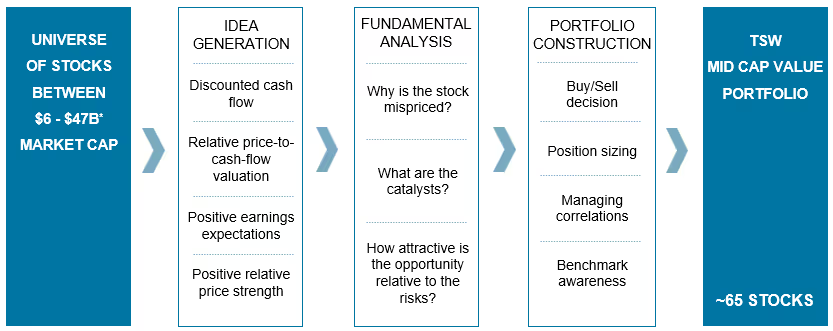
Our Mid Cap Value investment process concentrates on selecting individual stocks rather than configuring the portfolio to align with forecasts for the macro environment. (Figure 2)
The process is both disciplined and repeatable. We start by evaluating approximately 1,000 mid-cap companies using a proprietary process we call the “Four-Factor” screen. The screen ranks companies according to:
We then take a deeper fundamental dive into the companies with the highest combined rankings of the four factors. This qualitative analysis seeks to answer three questions:
Once we’ve addressed these questions, we focus on evaluating each stock’s upside potential and estimated downside risk and buy those whose potential returns are highest. We decide to sell stocks when their risk/reward profile is no longer in our favor, there has been a fundamental change to our investment case, or for portfolio risk considerations.
Figure 2. The TSW Mid Cap Value Investment Process Is Disciplined and Repeatable.
Here’s why we believe investors should consider TSW as their mid-cap value manager:
[1] The Five Dimension of Variant Perception; By Ron Rimkus, CFA. https://blogs.cfainstitute.org/investors/2015/11/27/the-five-dimensions-of-variant-perception/
[2] Market capitalization range is based on the annual reconciliation of the FTSE Russell equity indices as of 6/30/2022.
[3] Morningstar data as of 12/31/2021.
[4] FTSE Russell data as of 12/31/2021.
[5] TSW research. Risk-adjusted returns measured by the Sharpe ratio.
*Market range is based on the annual reconstitution of the Russel Indices as of 6/30/2022.
IMPORTANT DISCLOSURE INFORMATION:
Important Disclosure: This commentary is intended for informational purposes only and does not constitute a complete description of our investment services, analysis, or performance. This commentary is in no way a solicitation or an offer to sell securities or investment advisory services. The expressed views and opinions contained herein are for informational purposes only, are based on current market conditions, and are subject to change without notice. Although information, opinions, and statistics contained herein have been obtained from sources believed to be reliable and are accurate to the best of our knowledge, Thompson, Siegel & Walmsley LLC (“TSW”) cannot and does not guarantee the accuracy, validity, timeliness, or completeness of such information and statistics made available to you for any particular purpose. This commentary should not be considered as investment advice or a recommendation of any particular security, strategy, or investment product. Past performance is not indicative of future results. No part of this commentary may be reproduced in any form, distributed, or referred to in any other publication, without express written permission of TSW.
GENERAL ECONOMIC & MARKET COMMENTARY DISCLOSURE: Comments and general market related projections are based on information available at the time of writing and believed to be accurate; are for informational purposes only, are not intended as individual or specific advice, may not represent the opinions of the entire firm and may not be relied upon for future investing. Certain information contained in this material represents or is based upon forward-looking statements, which can be identified by the use of terminology such as “may”, “will”, “should”, “expect”, “anticipate”, “target”, “project”, “estimate”, “intend”, “continue” or “believe” or the negatives thereof or other variations thereon or comparable terminology. Due to various risks and uncertainties, actual events or results or the actual performance of an Account may differ materially from those reflected or contemplated in such forward-looking statements. Investors are advised to consult with their investment professional about their specific financial needs and goals before making any investment decisions. Past performance is not indicative of future results.
BENCHMARK SOURCE: Russell Investments. Russell Investment Group is the source and owner of the trademarks, service marks and copyrights related to the Russell Indexes. Russell® is a trademark of Russell Investment Group.
INDEX DEFINITIONS:
- Russell 1000® Index: The Russell 1000® Index measures the performance of the large-cap segment of the US equity universe. It is a subset of the Russell 3000® Index and includes approximately 1,000 of the largest securities based on a combination of their market cap and current index membership.
- Russell Midcap® Value Index: The Russell Midcap® Index measures the performance of the mid-cap segment of the U.S. equity universe. The Russell Midcap® Index is a subset of the Russell 1000® Index. It includes approximately 800 of the smallest securities based on a combination of their market cap and current Index membership.
- Russell 2000® Growth Index: The Russell 2000® Index measures the performance of the small-cap segment of the U.S. equity universe. The Russell 2000 Index is a subset of the Russell 3000® Index and includes approximately 2,000 of the smallest securities based on a combination of their market cap and current index membership.
EQUITY SECURITIES RISK: Equity securities generally have greater risk of loss than debt securities. Stock markets are volatile, and the value of equity securities may go up or down, sometimes rapidly and unpredictably. The value of equity securities fluctuates based on real or perceived changes in a company’s financial condition, factors affecting a particular industry or industries, and overall market, economic and political conditions. If the market prices of the equity securities owned by the strategy fall, the value of your investment in the strategy will decline. Your portfolio may lose its entire investment in the equity securities of an issuer. A change in financial condition or other event affecting a single issuer may adversely impact securities markets as a whole.
PRINCIPAL RISK: Risk is inherent in all investing. Many factors and risks affect performance. The value of your investment, as well as the amount of return you receive on your investment, may fluctuate significantly day to day and over time. You may lose part or all of your investment in your portfolio or your investment may not perform as well as other similar investments. An investment in the strategy is not a bank deposit and is not insured or guaranteed by the Federal Deposit Insurance Corporation or any other government agency. You may lose money if you invest in this strategy.
VALUE INVESTING RISK: The prices of securities TSW believes are undervalued may not appreciate as anticipated or may go down. The value approach to investing involves the risk that stocks may remain undervalued, undervaluation may become more severe, or perceived undervaluation may actually represent intrinsic value. Value stocks as a group may be out of favor and underperform the overall equity market for a long period of time, for example, while the market favors “growth” stocks.
For additional information regarding potential risks to your investment please see risk disclosures in our Form ADV Part 2A found here https://www.tswinvest.com/.
© 2023 Thompson, Siegel & Walmsley LLC (“TSW”). TSW is an investment adviser registered with the SEC. Registration does not imply a certain level of skill or training. All information contained herein is believed to be correct but accuracy cannot be guaranteed. TSW and its employees do not provide tax or legal advice. Past performance is not indicative of future results; past performance does not guarantee future results, and other calculation methods may produce different results. There is the possibility of loss of principal value. Certain GIPS® disclosures are provided on TSW’s website at www.tswinvest.com, others are available upon request.
Brett is a graduate of the University of Richmond, BA and the University of Virginia, Darden School, MBA. Previously, he was employed with Arthur Andersen LLP as a Senior Associate and First Union Securities, Inc, Assistant Vice President, Equity Research. He holds the Chartered Financial Analyst® designation. He is registered as an Investment Adviser Representative. Check the Background of this Investment Professional here.

Subscribe to receive the latest news and updates
You are now leaving the TSW website. This link is provided as a convenience, and Thompson, Siegel & Walmsley is not responsible for the content provided on your destination site.
You are now leaving the TSW website. This link is provided as a convenience, and Thompson, Siegel & Walmsley is not responsible for the content provided on your destination site.
You are now leaving the TSW website. This link is provided as a convenience, and Thompson, Siegel & Walmsley is not responsible for the content provided on your destination site.